Designing an Employer Control Center for Earned Wage Access
From fragmented payroll insights to clear control
In high-turnover industries, employers often manage Earned Wage Access (EWA) through a chaotic web of emails, chats, spreadsheets, and shift logs.
This fragmentation leads to a significant “blind spot” regarding how wage access affects cash flow, compliance, and staff retention.
As the Lead Product Designer, I spearheaded the creation of a B2B Employer Control Center that transforms this operational chaos into a strategic advantage.
Duration
When Payroll Operations Become Fragmented
Employers were managing wage requests across disconnected tools with no single source of truth. This lack of integration forced managers and HR teams into manual cross-checks, resulting in three primary operational losses:
Blind Spots: No shared view of risk, policy violations, or the program’s impact on retention.
Lack of Truth: Disconnected data across scheduling, payroll, and banking tools.
Manual Overhead: Informal requests requiring tedious manual verification and approval.
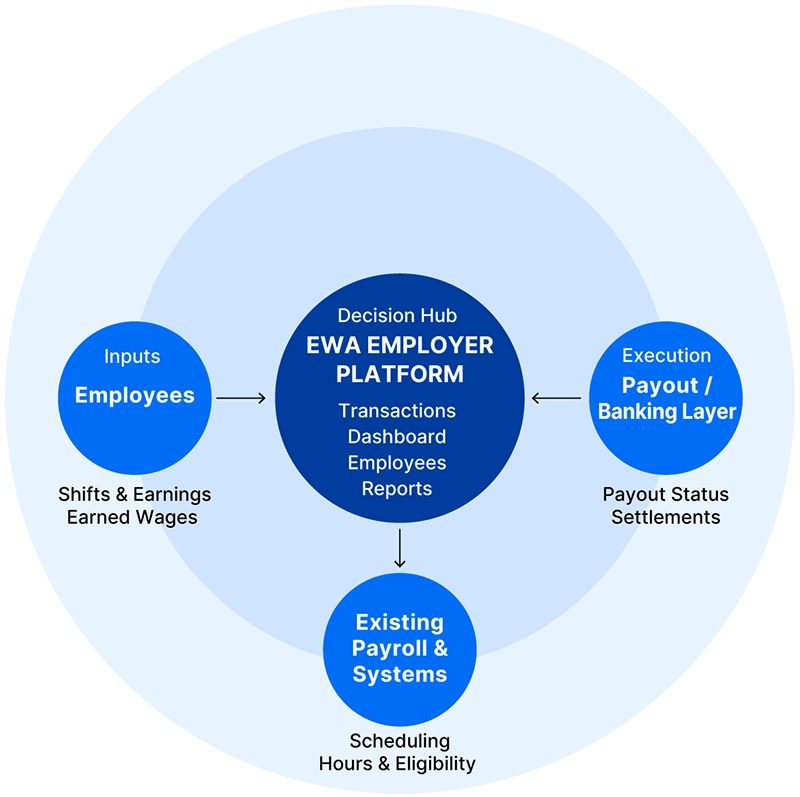
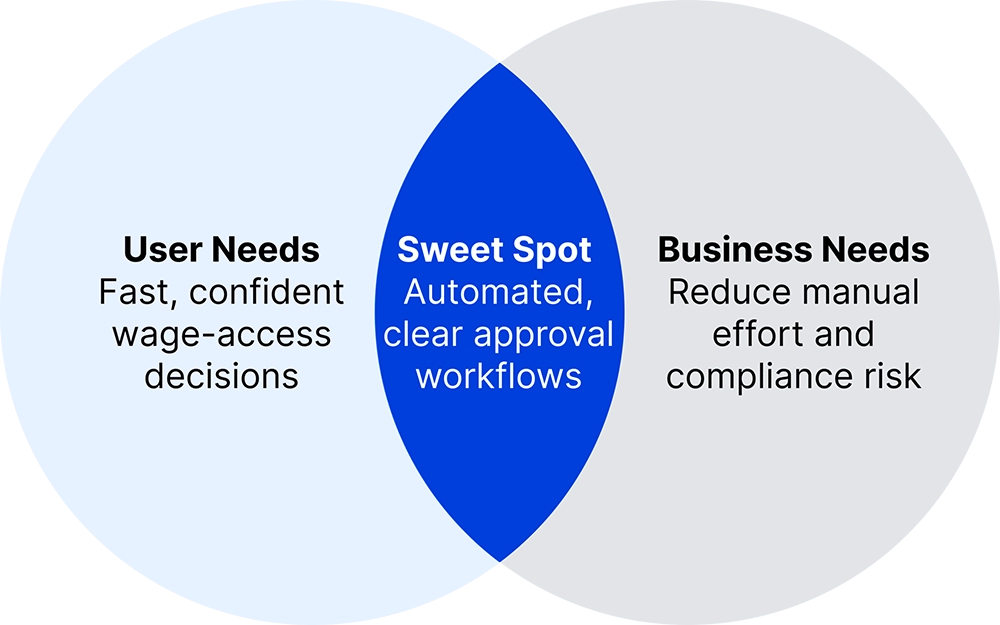
The platform unifies a fragmented ecosystem employees, payroll and scheduling systems, and banking/payout layers into a single, coherent employer control center. This integration supports the core objective: enabling fast, confident managerial decisions while systematically reducing compliance risk through automated, policy-driven workflows.
Competitive analysis shows no insight-driven employer view
A competitive analysis of direct and indirect EWA solutions revealed a clear gap. Most platforms either prioritize the employee experience with minimal employer control, or offer heavy admin systems overloaded with raw, fragmented data. Existing platforms provide data visibility but rarely connect daily activity to business outcomes such as risk, liquidity, or retention.
This gap revealed the opportunity for a control center focused on signals, priorities, and ROI.
Comparing employer visibility, decision support, and business impact across existing platforms.
| Provider | Focus | Employer Visibility & Control | Business-Impact Visibility | Integration & UX |
|---|---|---|---|---|

![]() | Employee-first + admin | Medium request oversight | Low-Medium limited employer narrative | Strong integration, employer UI feels reactive |

![]() | Wellness suite + admin | Medium controls spread across screens | Medium metrics, weak decision linkage | Strong integration, complex employer UX |

![]() | Mobile-first, employee-centric | Low - limited employer controls | Low - minimal ROI/ time-saved visibility | Basic integration, shallow for managers |
| Our Platform | Employer control center | High - clear views by status/eligibility/ exceptions | High - explicit ops + retention impact | Decision-first employer UX |
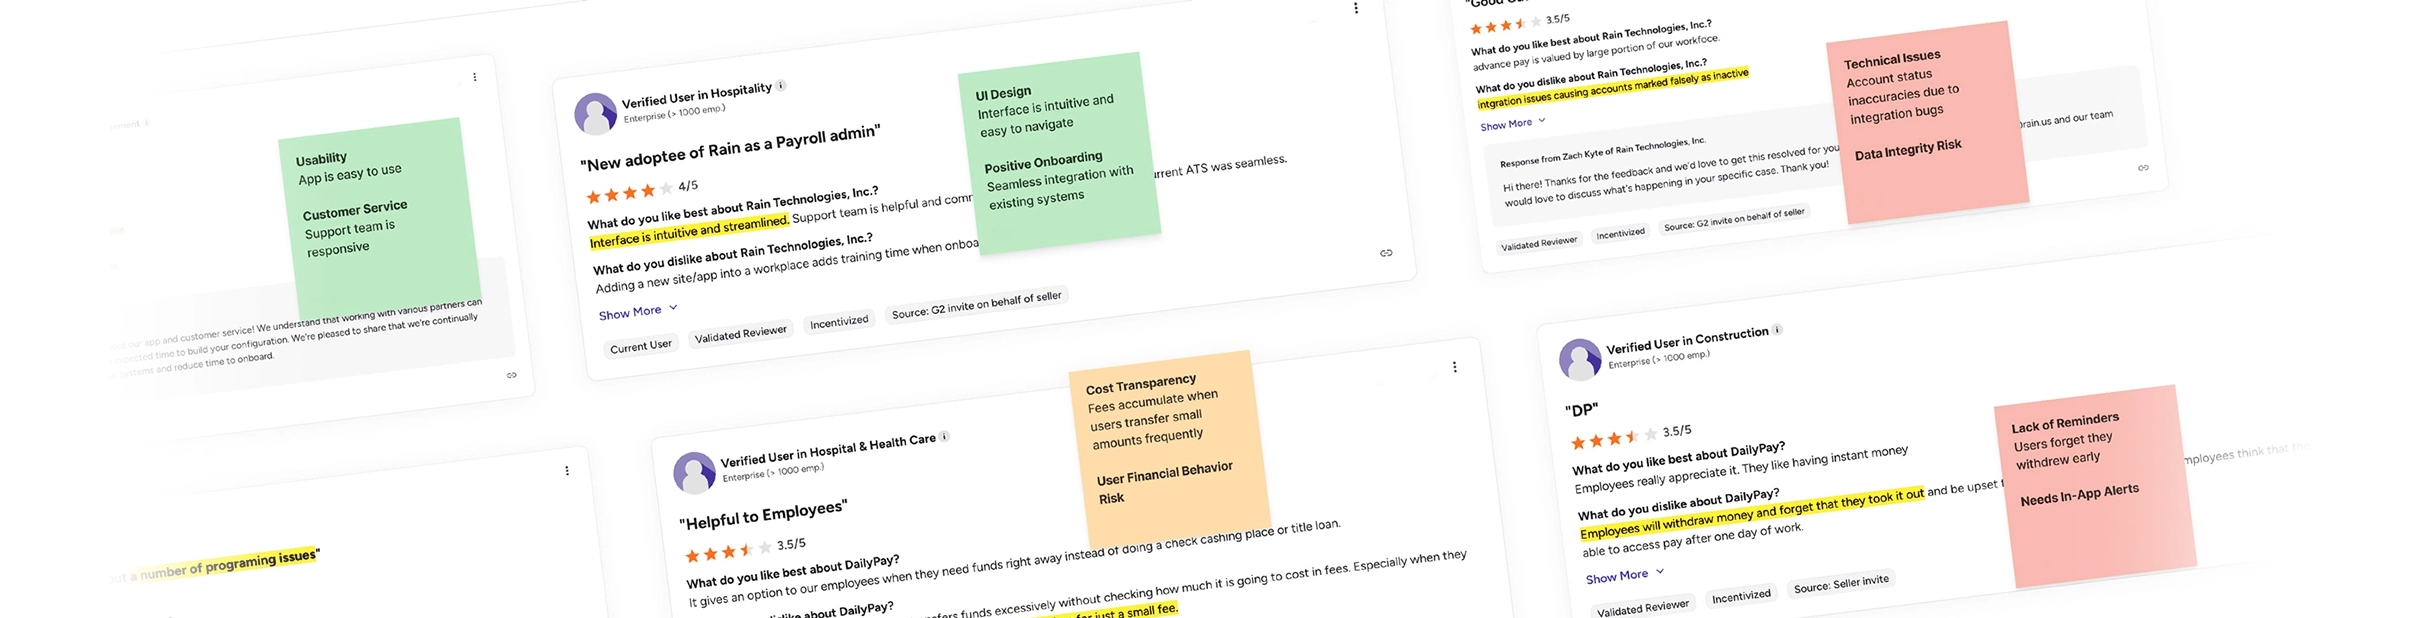
Employee-First Products, Limited Employer Insight
A broader competitive mapping combined product analysis with user review insights. This synthesis exposed recurring patterns: employee-first experiences with limited employer visibility, fragmented admin tools, and weak connections between daily activity and business outcomes.
Cmd/Ctrl + scroll to Zoom
From Visibility Gaps to Clear Signals
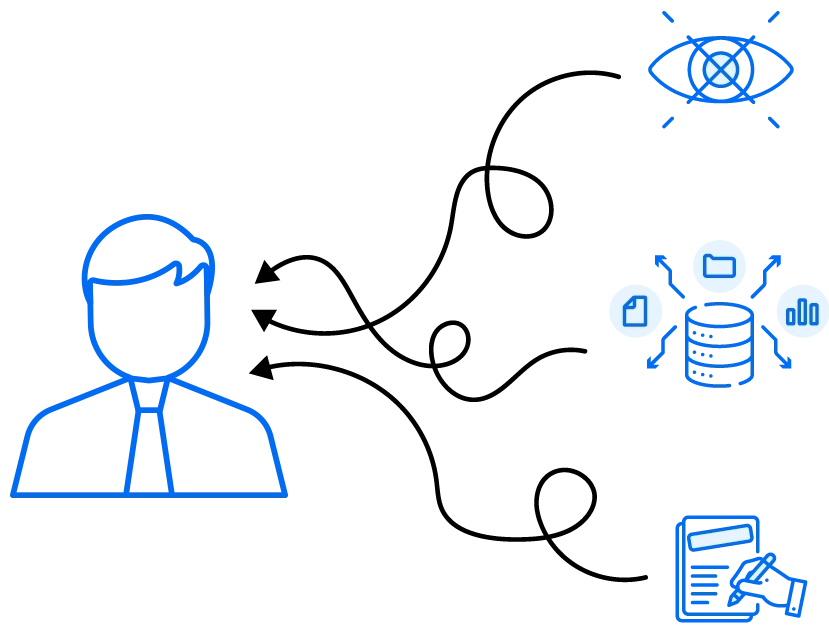
During the research phase, a recurring sentiment surfaced among managers: they felt they were “approving in the dark”. The core problem was not just the workload of the approval itself, but the lack of context. managers couldn’t see if a decision made sense in the bigger picture.
“I don’t actually see what’s going on... "
managers felt they were approving in the dark
Affinity Mapping exposed the absence of insight driven employer decisions
This allowed me to cluster pain points from various personas, such as HR managers at retail chains and small business owners. This research shifted our focus from simply managing a process to providing transparency into patterns, trends, and risk impact.
Through Affinity Mapping, a clear pattern emerged: employers lacked a clear view of usage patterns, risks, and request trends needed to make confident approval decisions.
Cmd/Ctrl + scroll to Zoom
Design pivot: from data scanning to instant insights
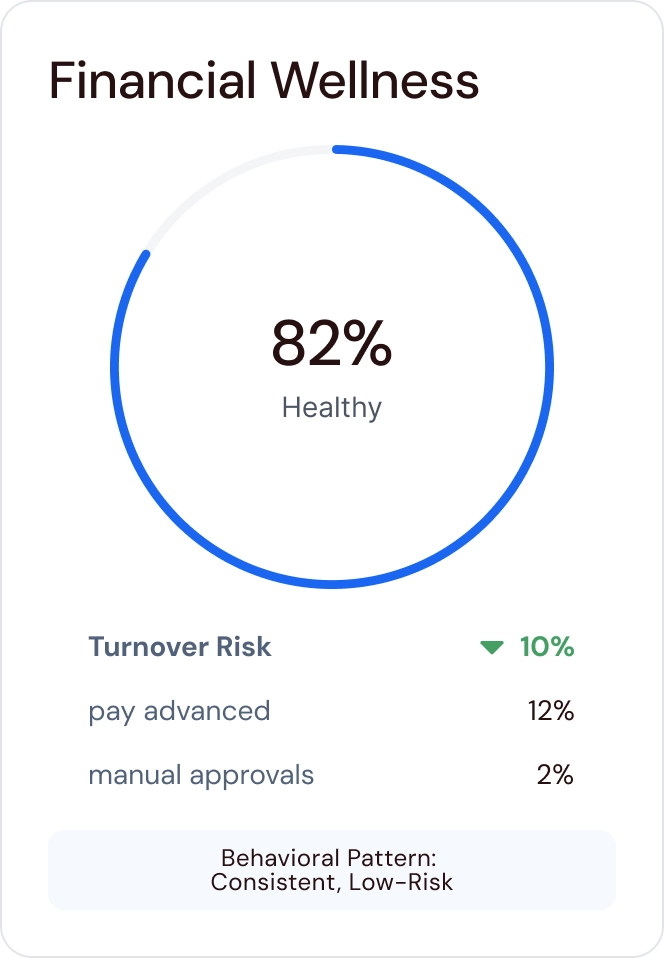
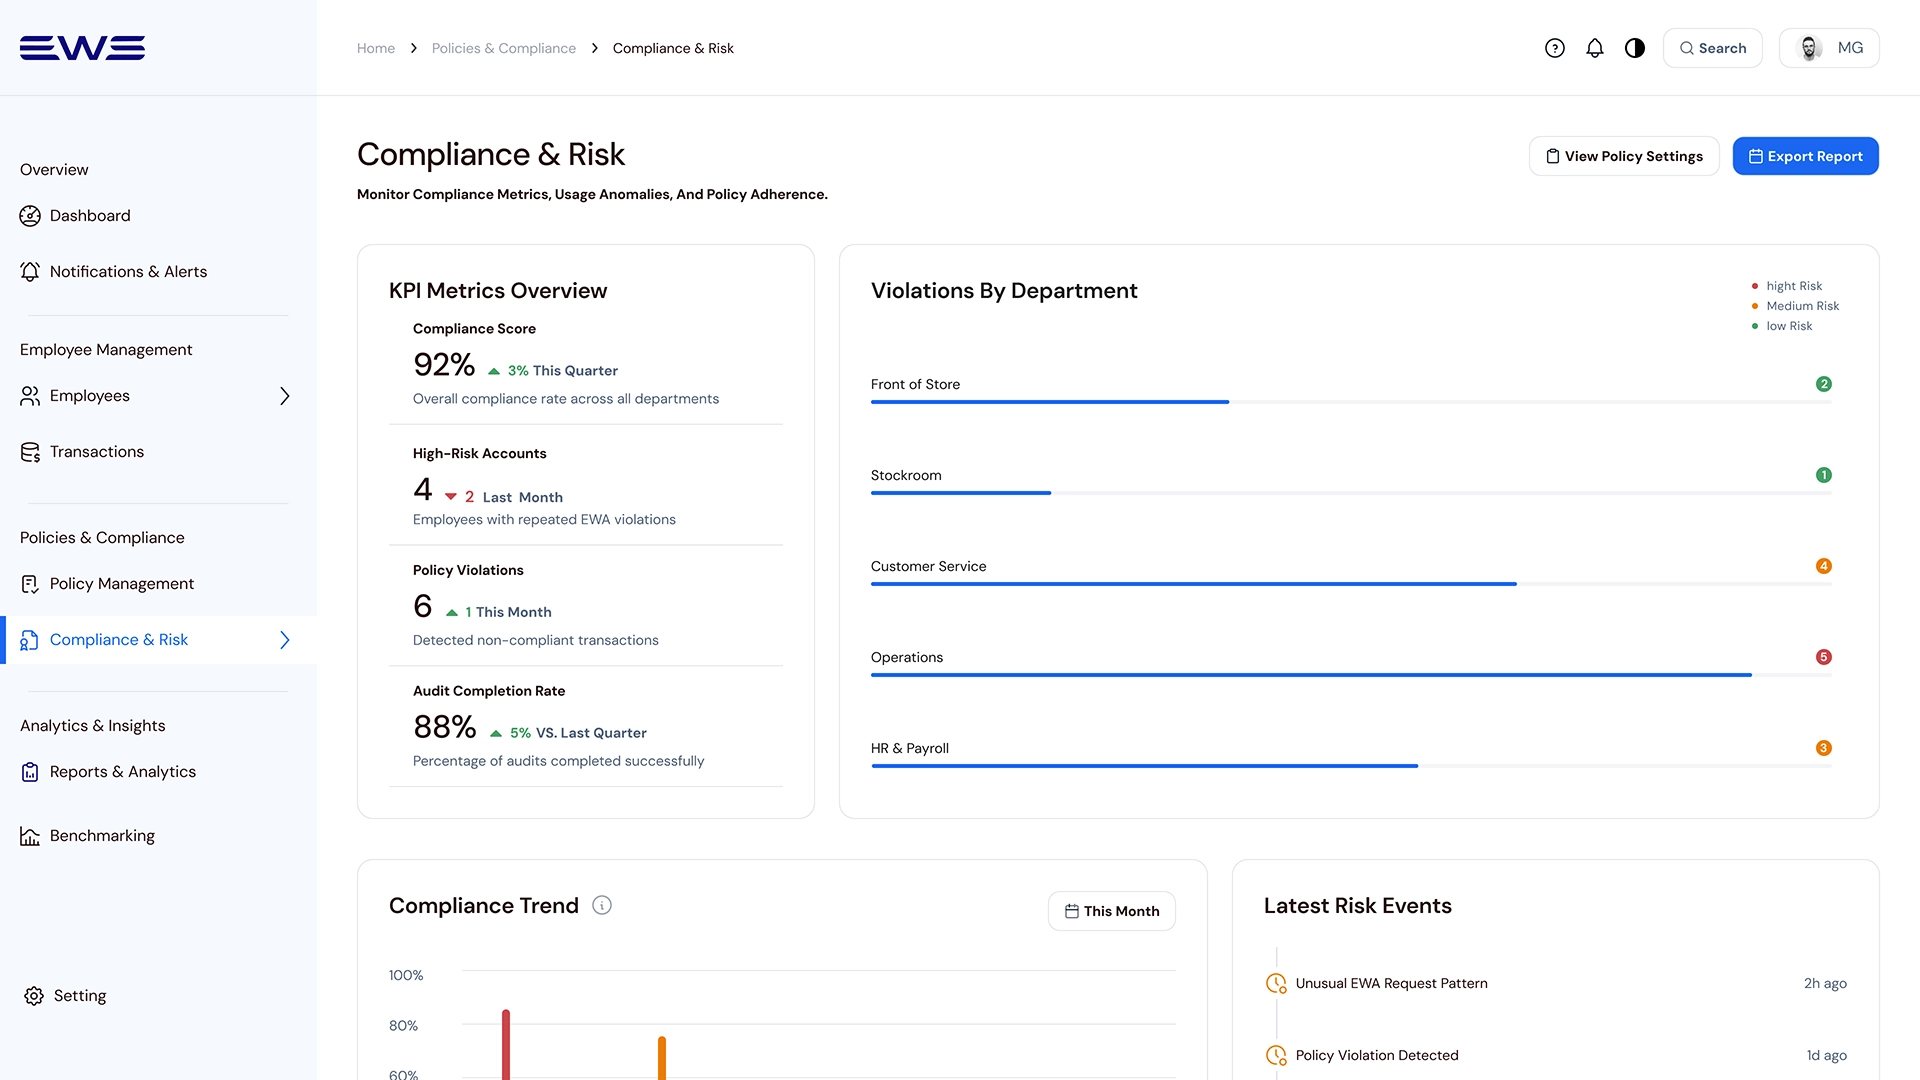
Instead of forcing managers to scan rows of data, we introduced unified KPI and wellness cards that communicate state and trend at a glance. This approach reduces cognitive load and immediately increases decision confidence.
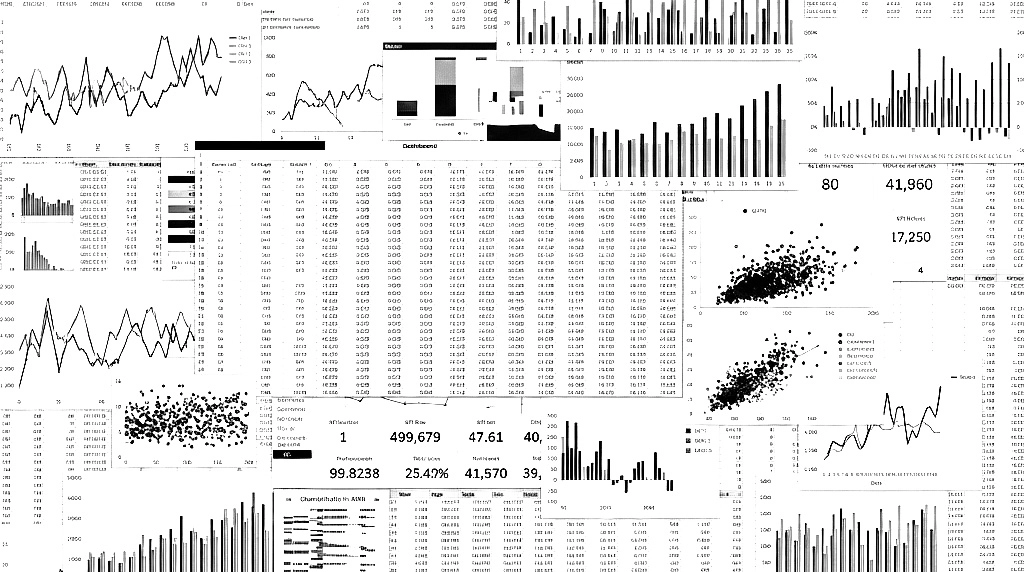
Fragmented tables and charts required manual scanning to interpret program health, risk, and employee behavior.
Defining a decision-driven product strategy
This phase set the strategic foundation of the product. The goal was not to optimize workflows, but to design a system that consistently guides managers from signals to decisions, and from decisions to measurable business impact.
HMW questions reframed the problem around decisions, not data
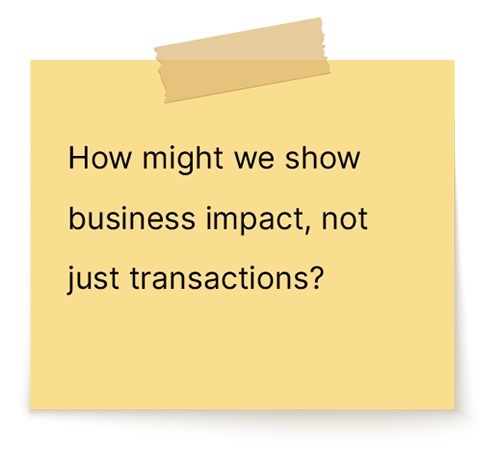
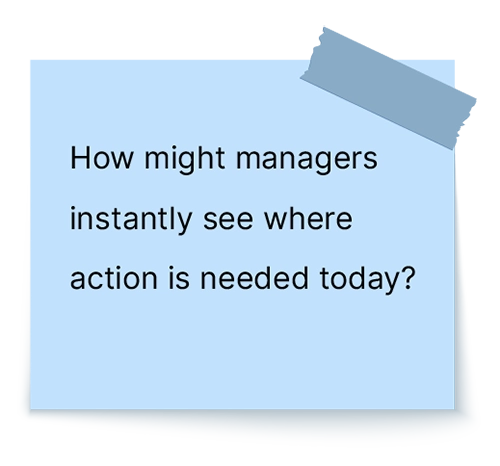
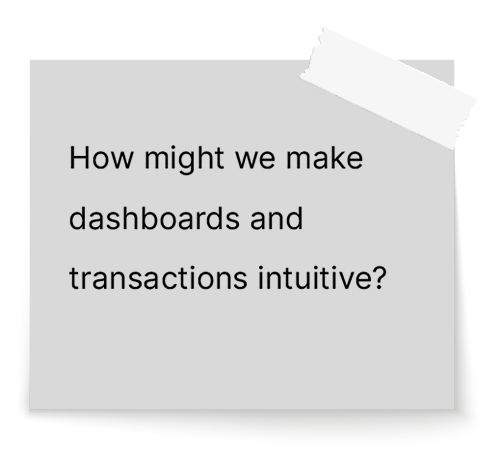
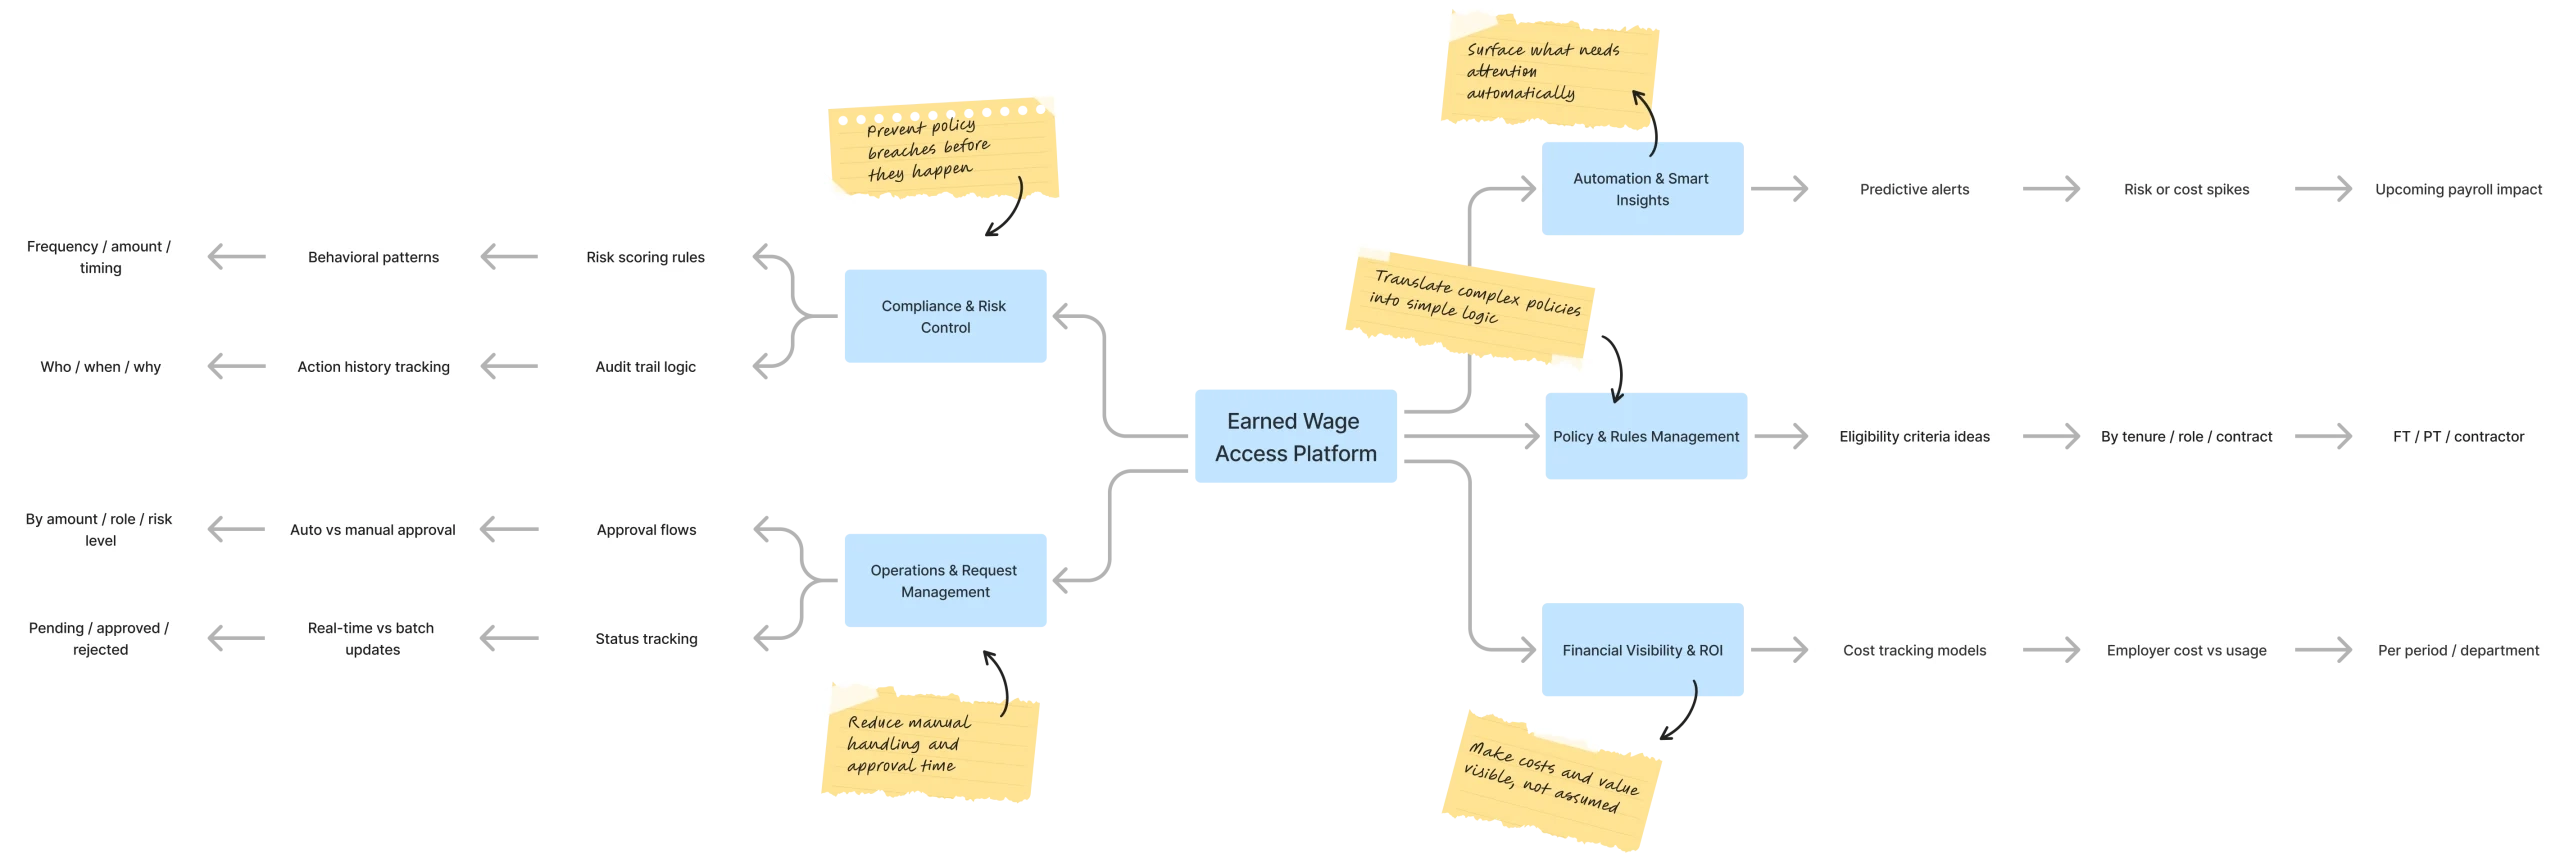
To translate these insights into a clear product roadmap, I addressed a set of “How Might We” (HMW) questions, specifically:
Strategic trade-off shifted the system
From data-heavy overviews to insights-first decisions
A critical decision involved the dashboard structure. I weighed a Data-Heavy Overview (Option A), which mirrors traditional HR tools, against an “Exceptions & Insights First” approach (Option B).

Long decision-making time
Industry Patter (Data-Heavy Overview)
Traditional data-heavy dashboards common in HR and payroll tools.

Short decision-making time
Chosen Direction (Insights First)
Exceptions & insights-first overview designed to reduce decision friction.
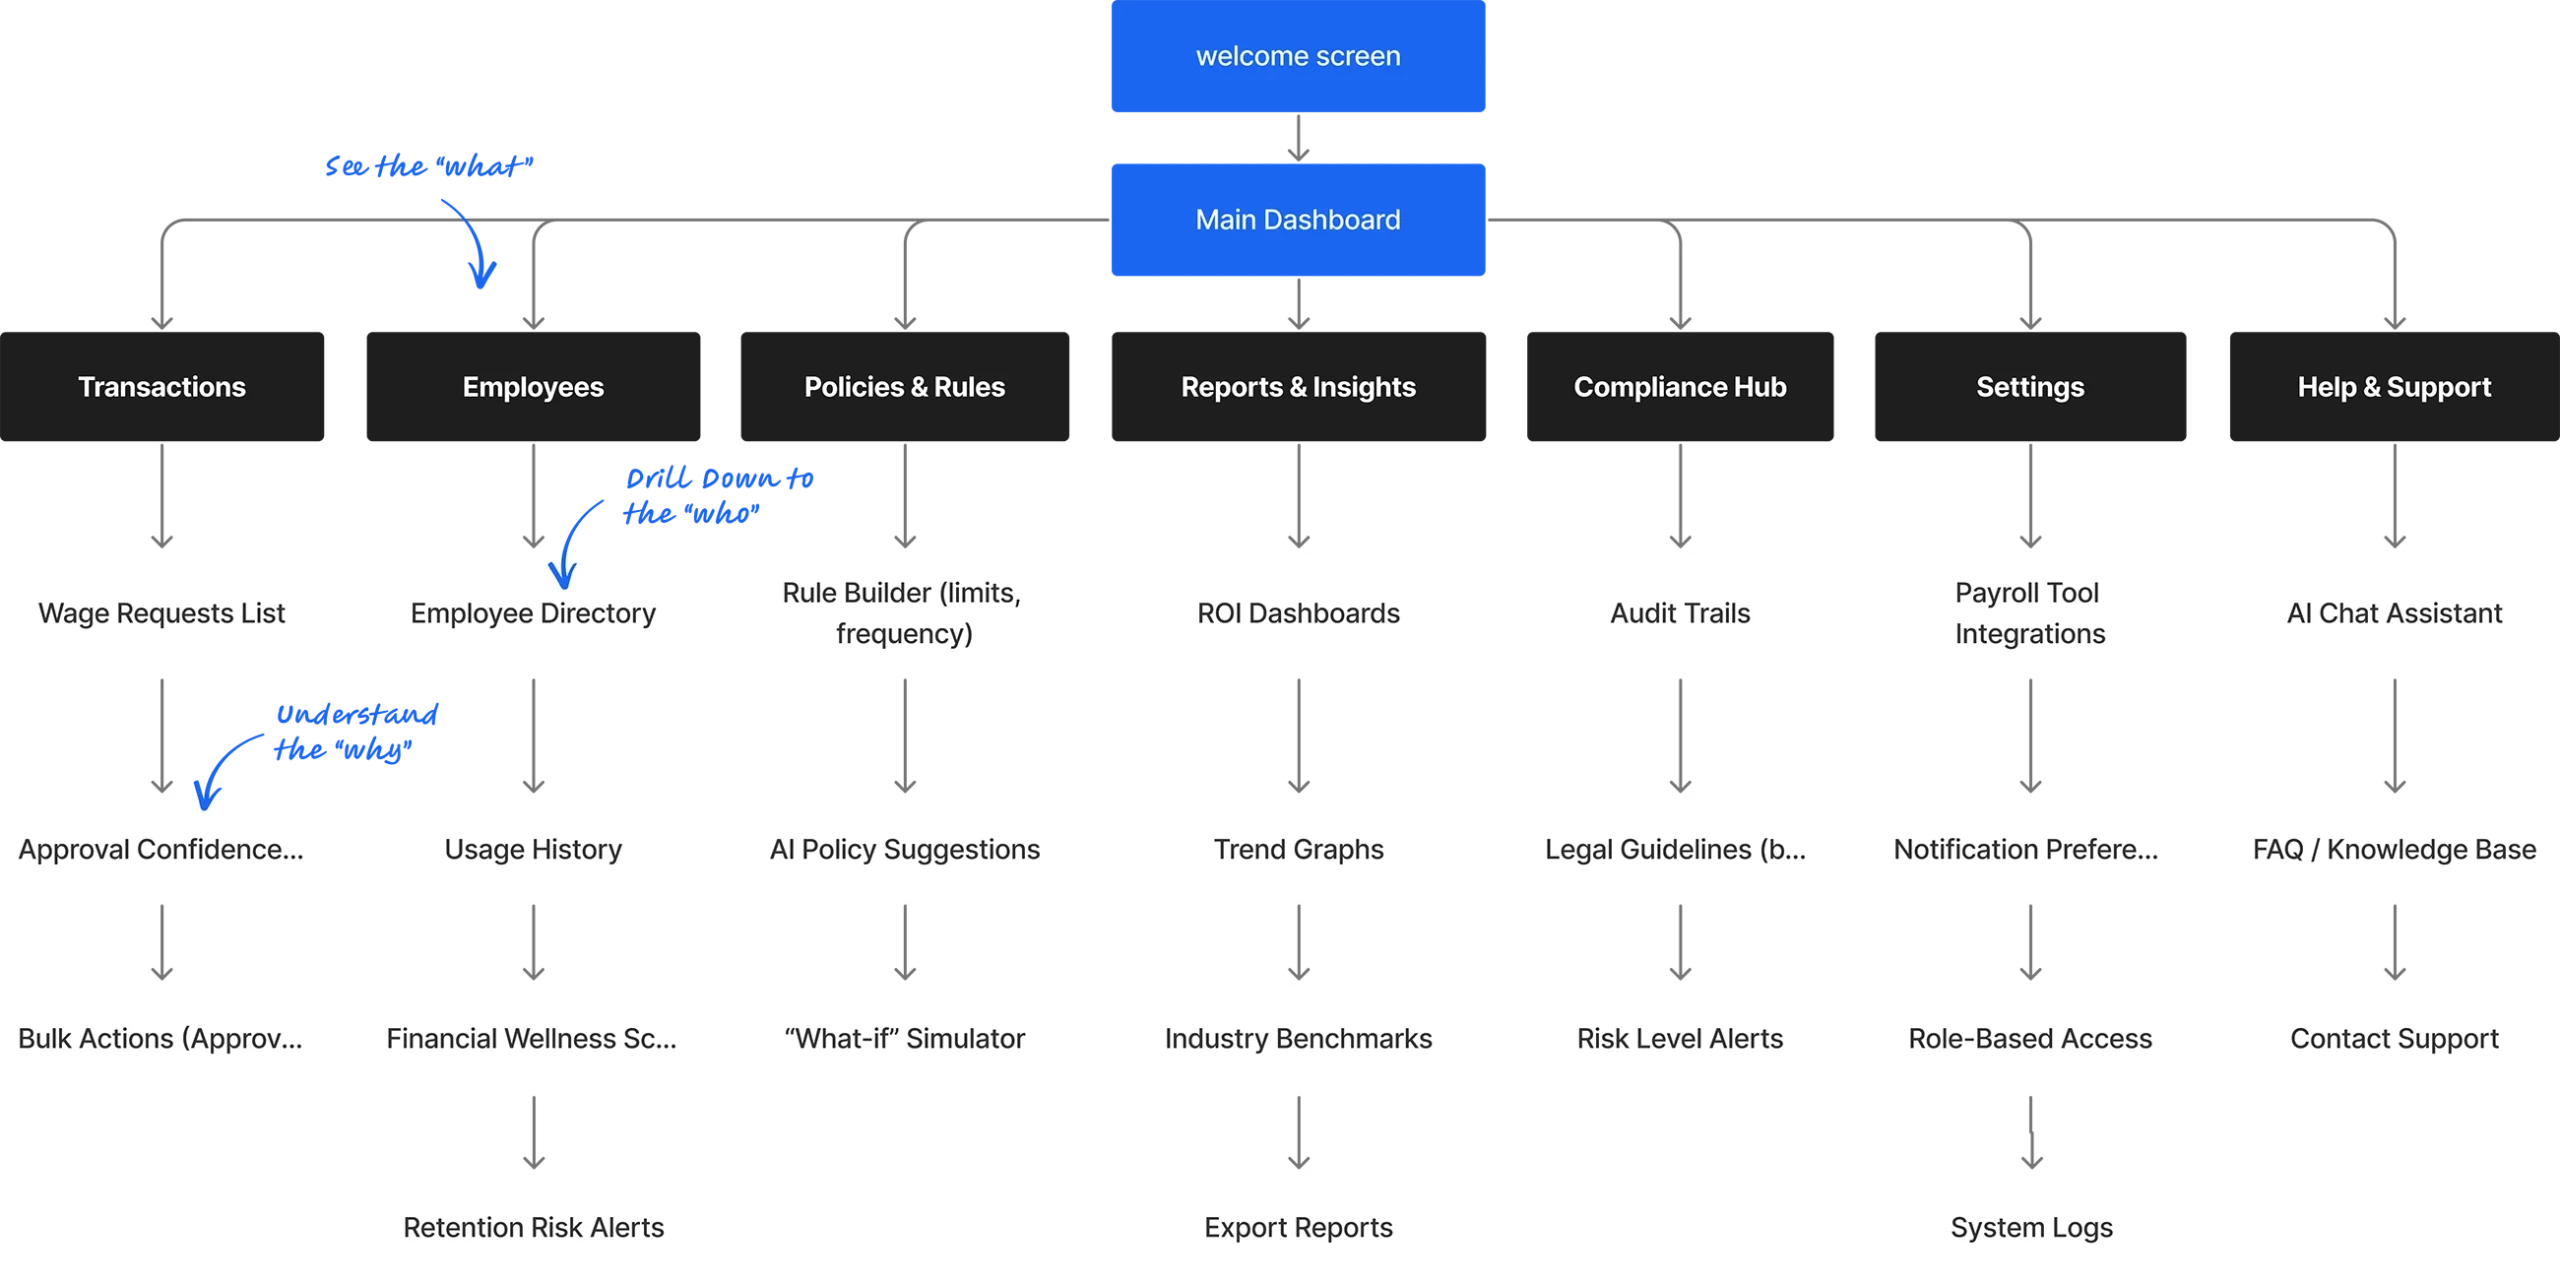
Information architecture connected overview signals to focused action
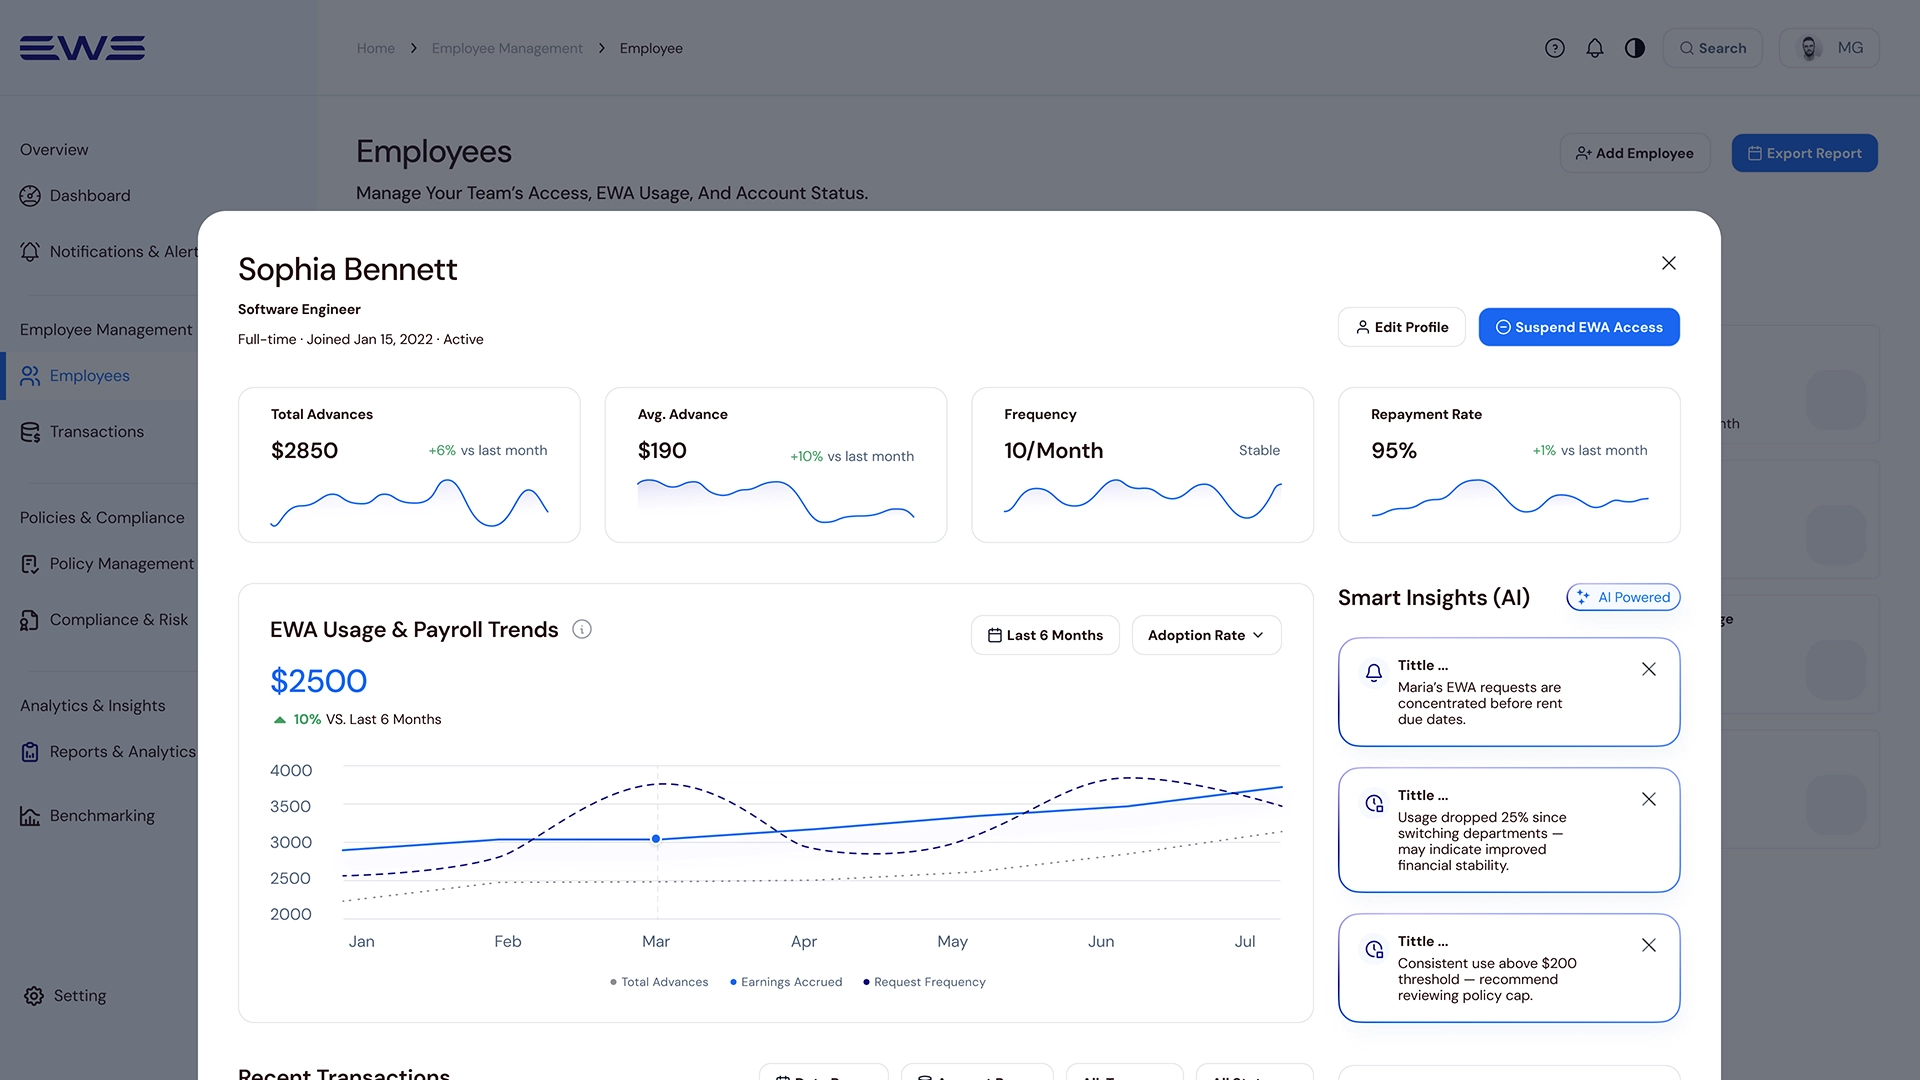
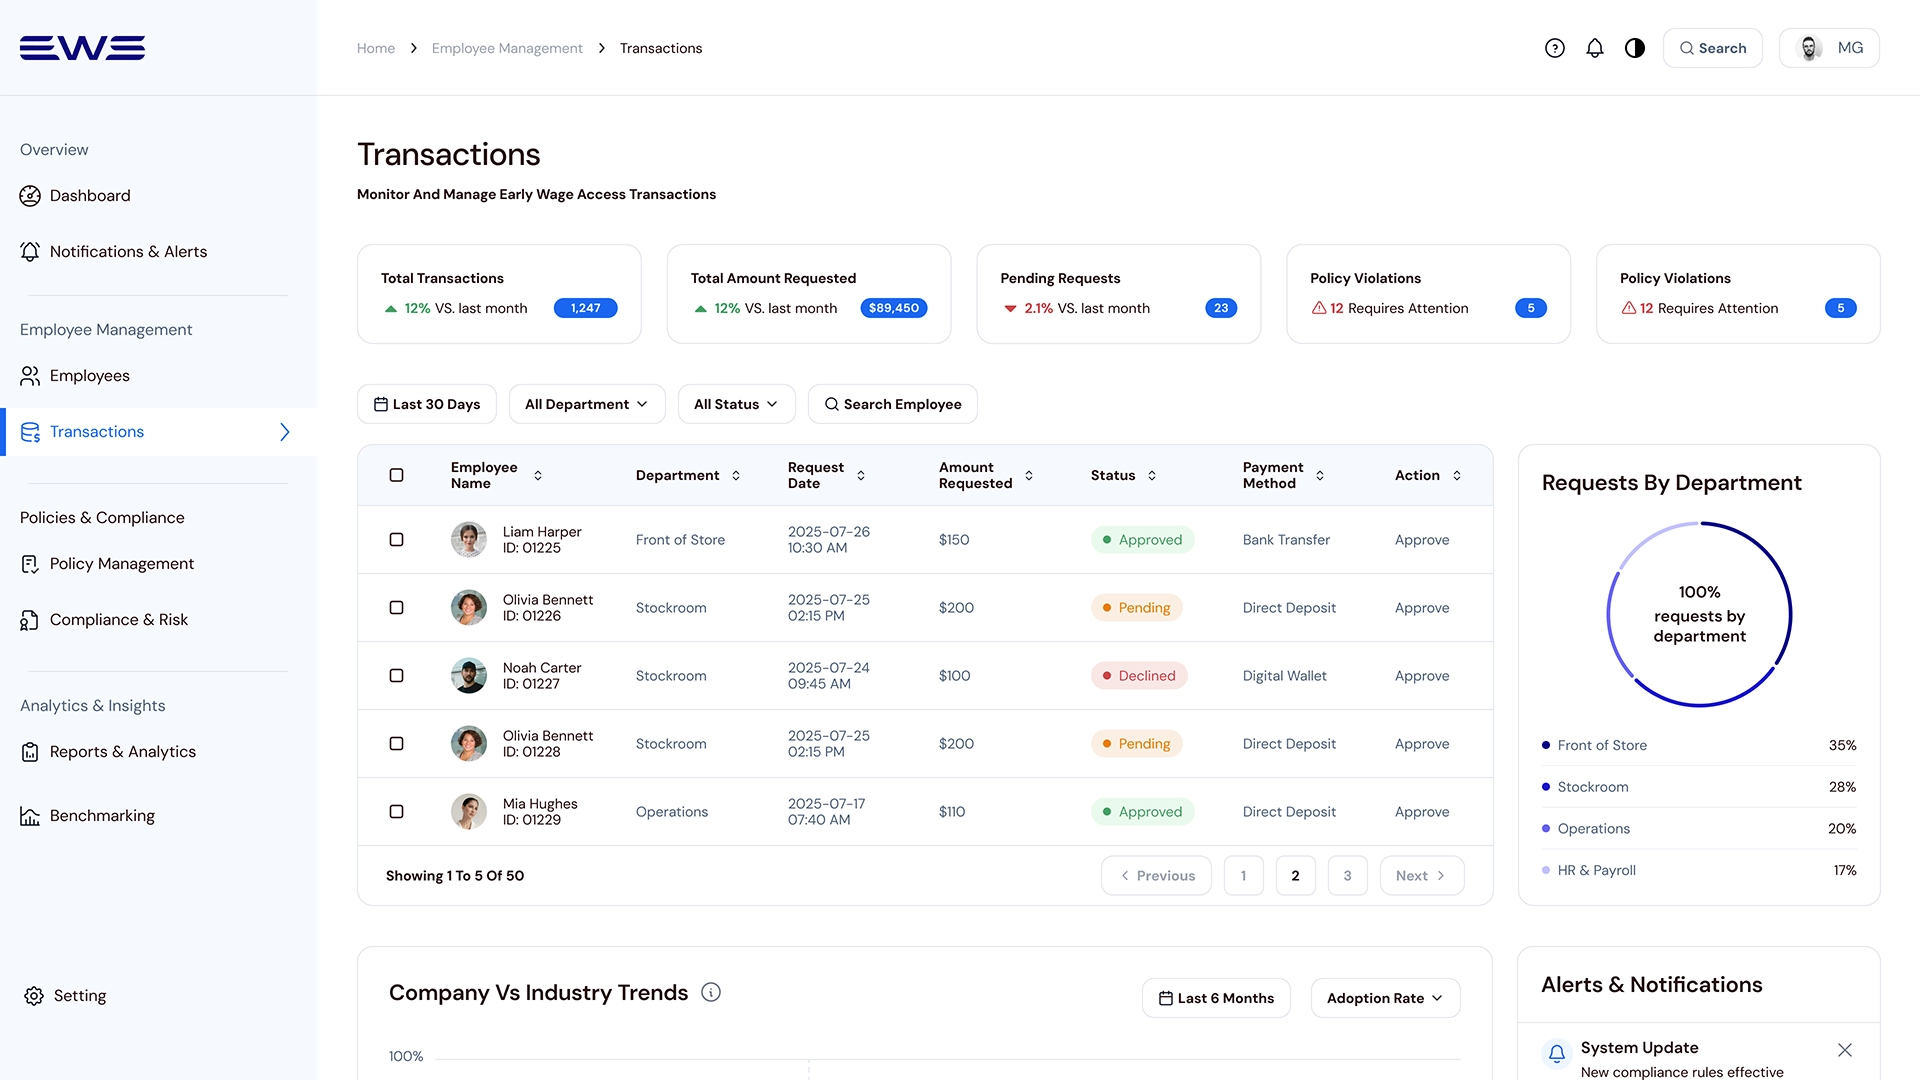
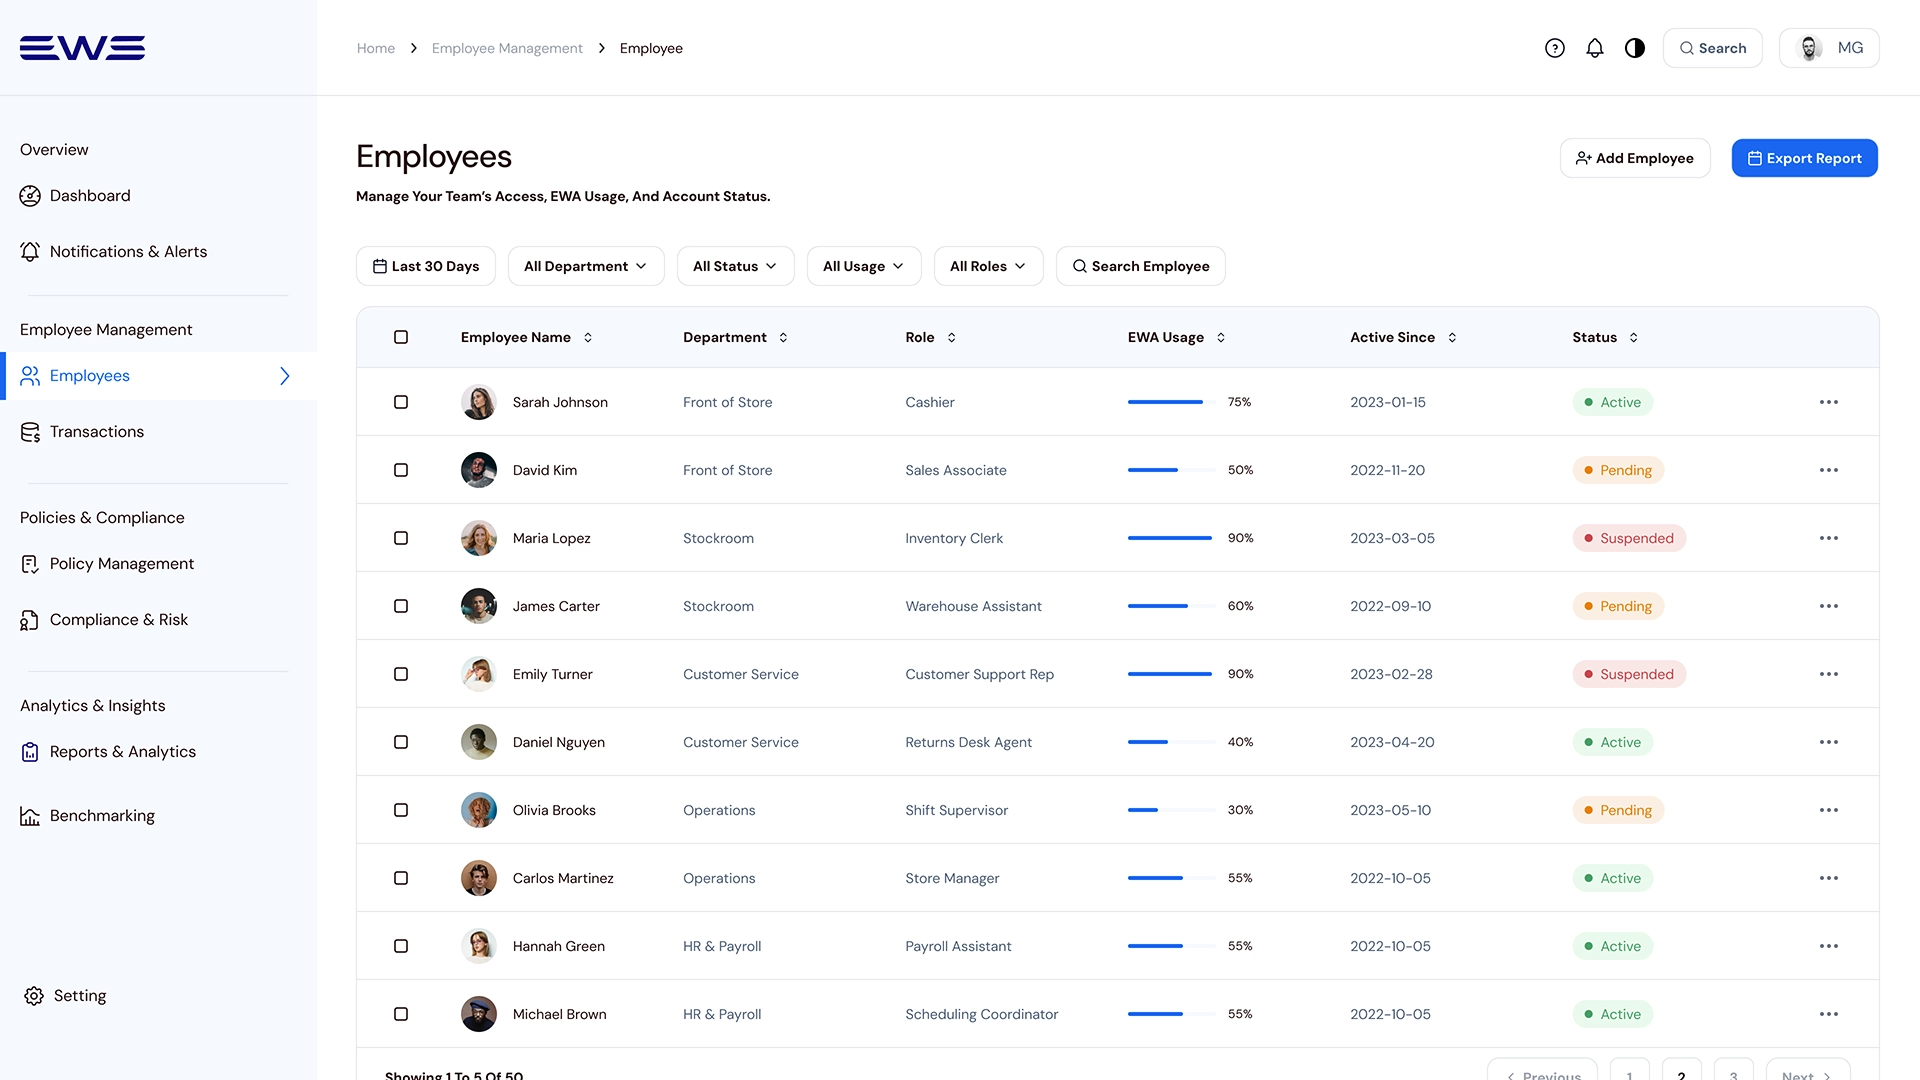
The structure connects the high-level program overview to detailed event-level views like Employee Details and Transactions, guiding users seamlessly from “what” to “why” to “who.”
How Employees & Transactions fit into the broader employer control center
A Decision-First Architecture
Every screen follows a consistent pattern: signals and exceptions first, tables second-guiding managers from ‘what’s wrong now?’ to ‘what to do about it’.
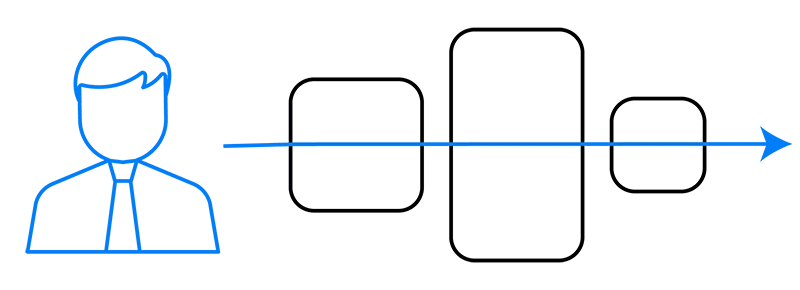
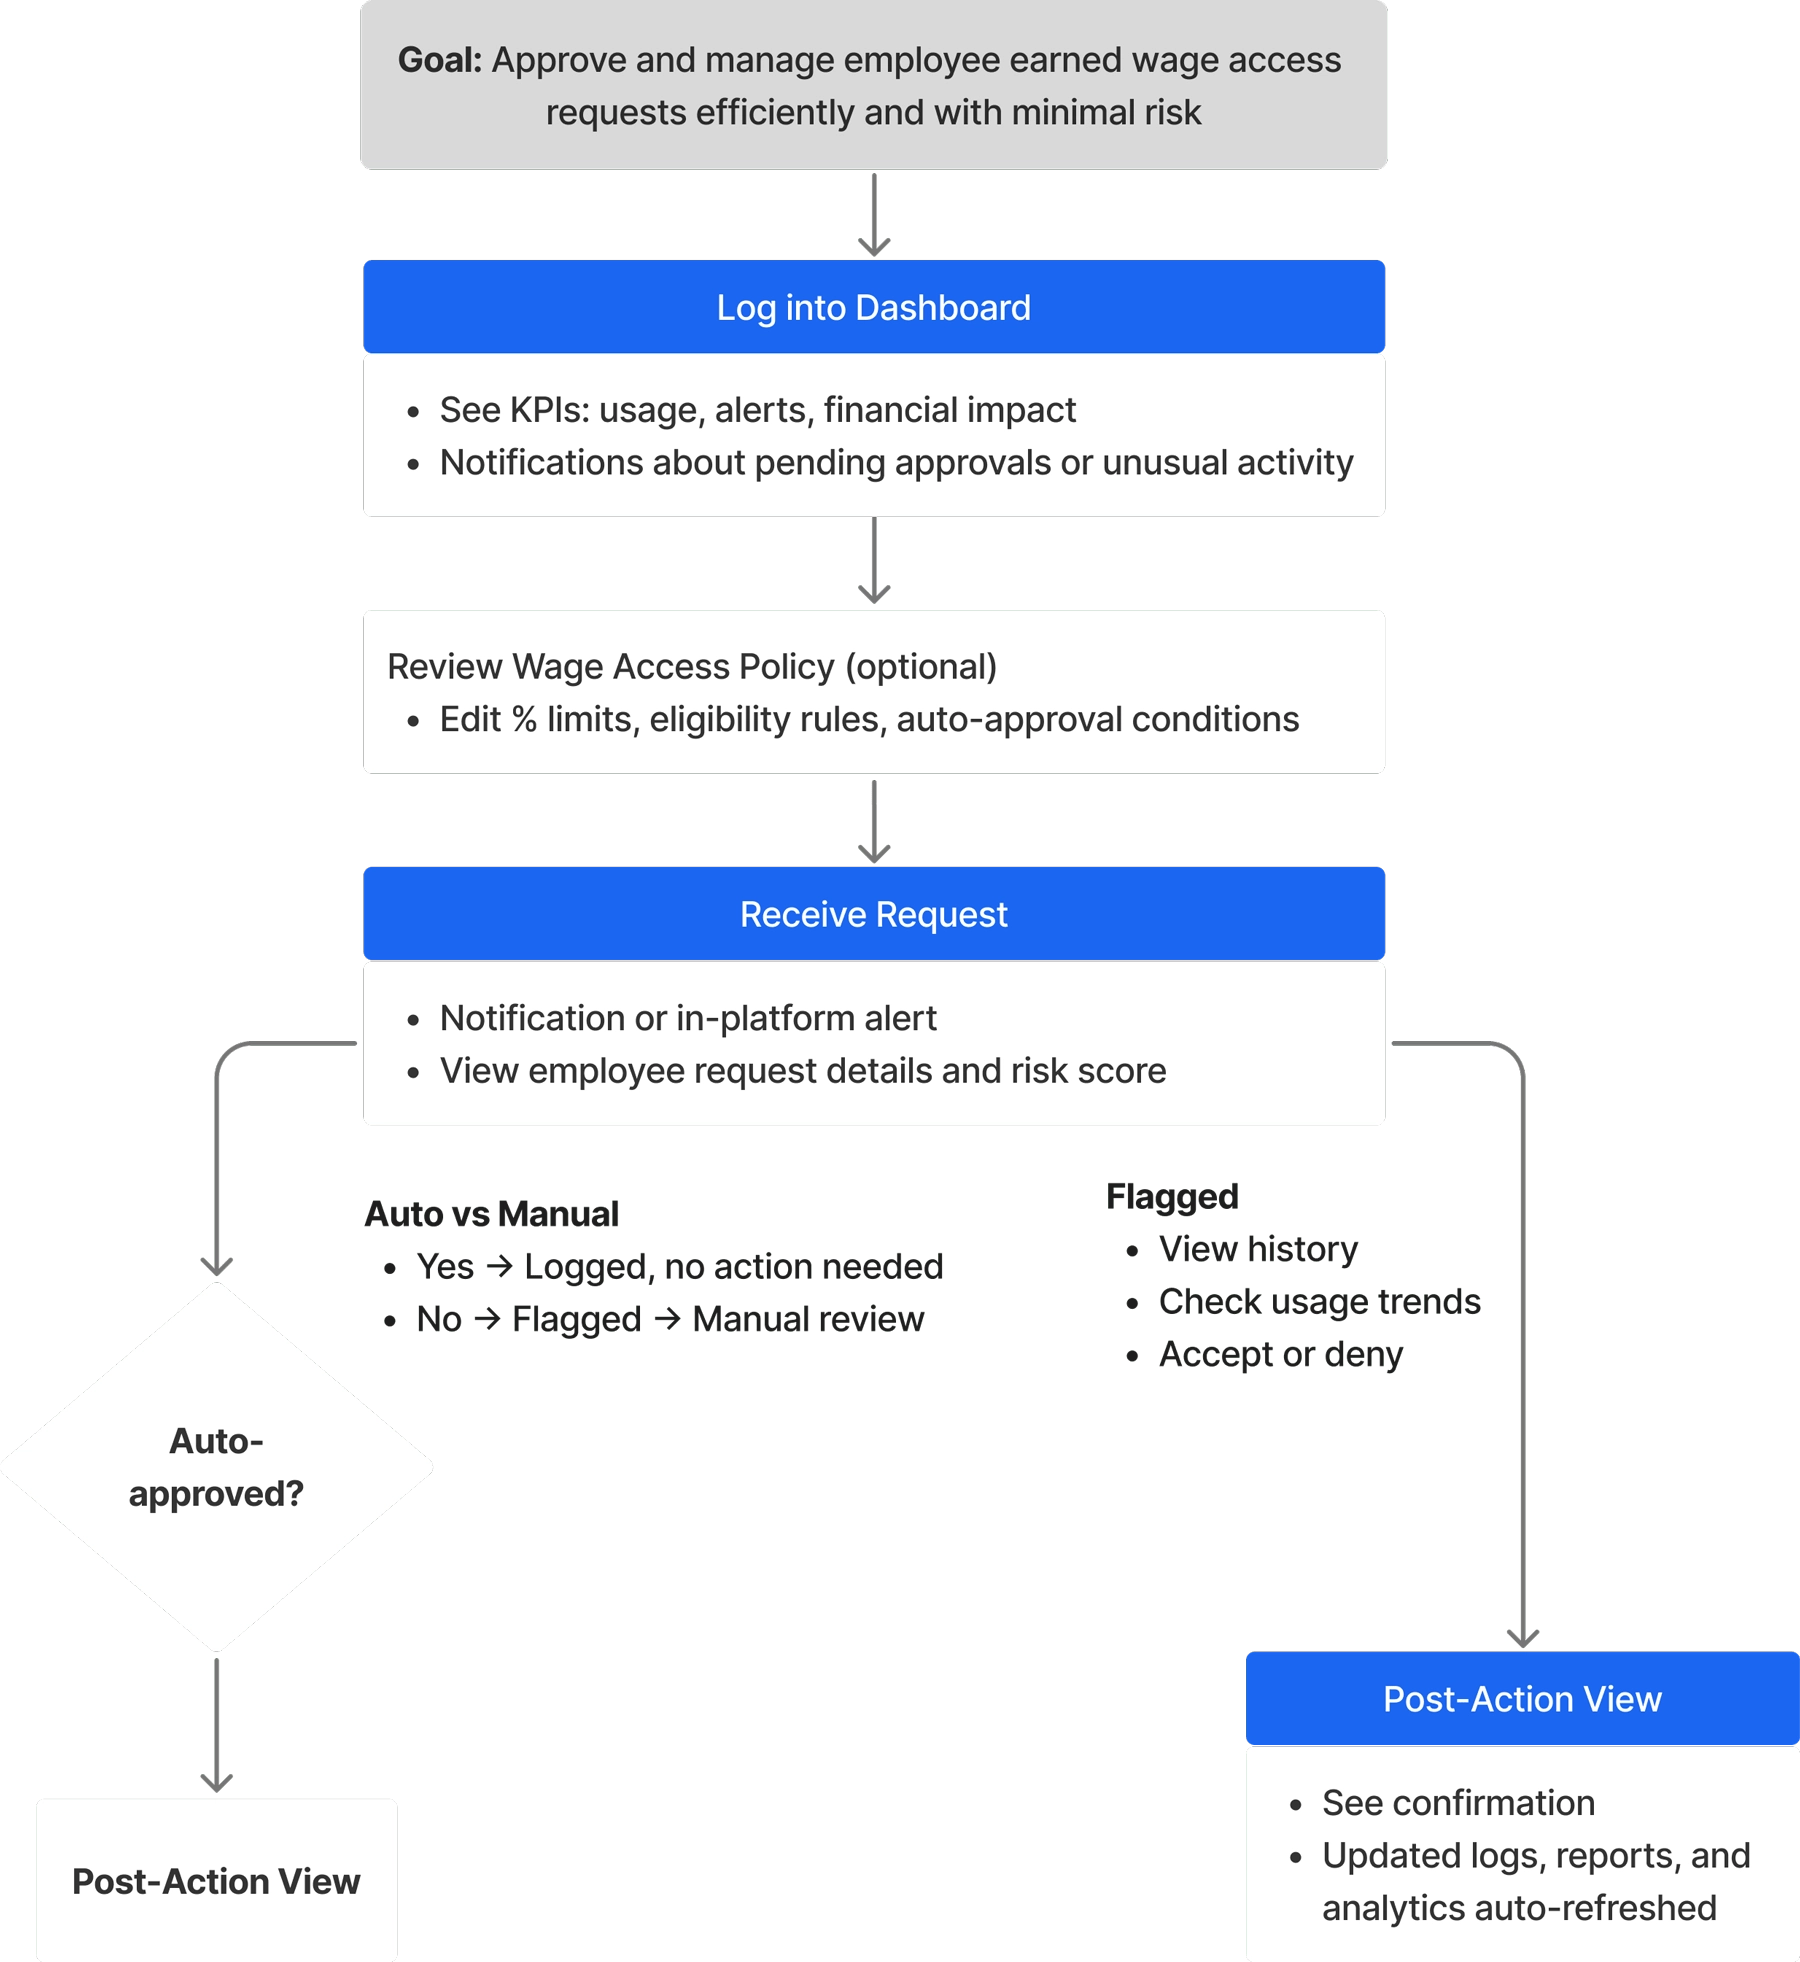
The user flow translates alerts and data signals into clear operational action
This flow maps the employer’s daily routine: from logging in to understand today’s workload, through handling flagged requests, to reviewing the impact of those decisions on overall program health.
A clear employer journey – from daily alerts to resolved actions and measurable impact.
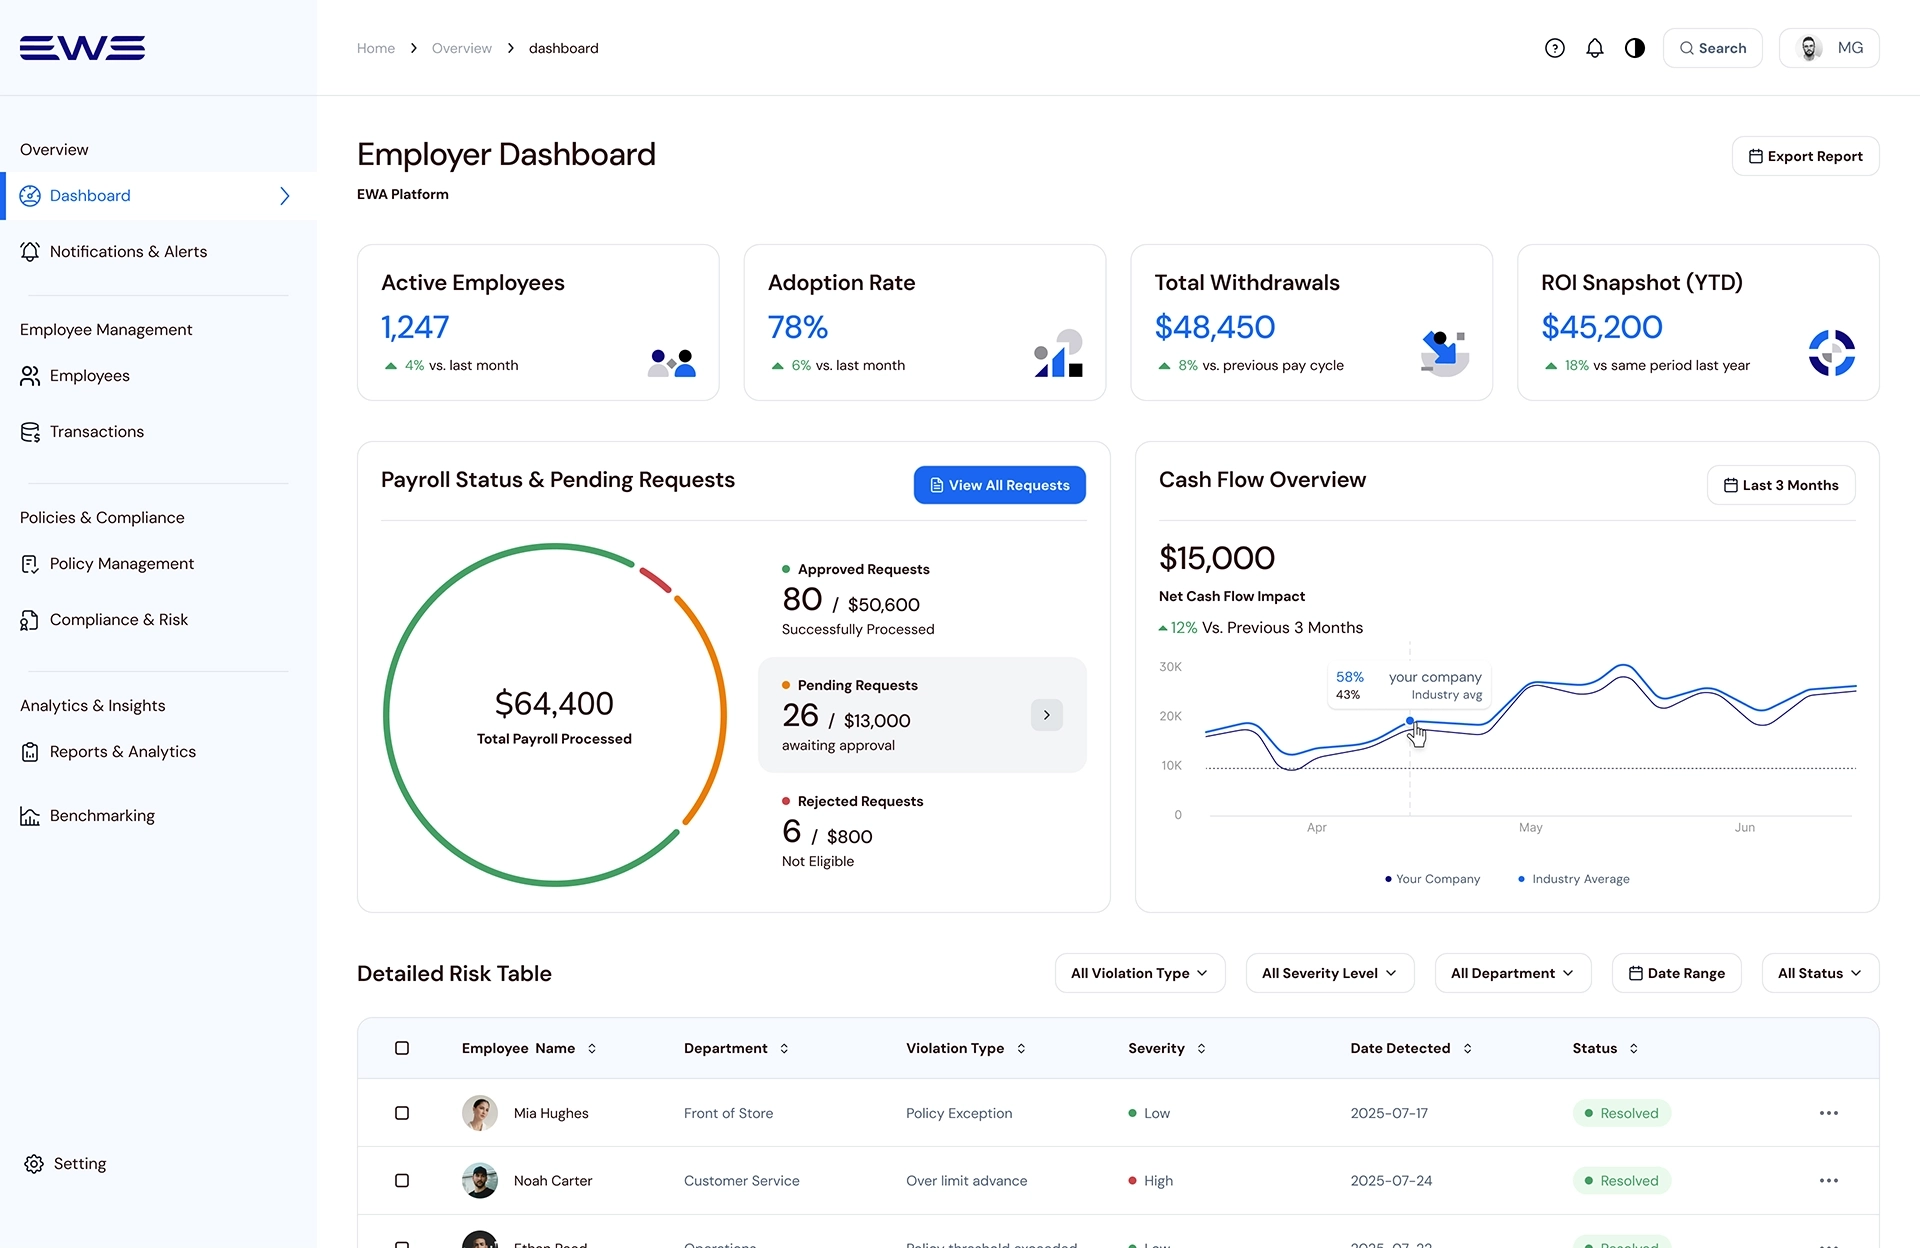
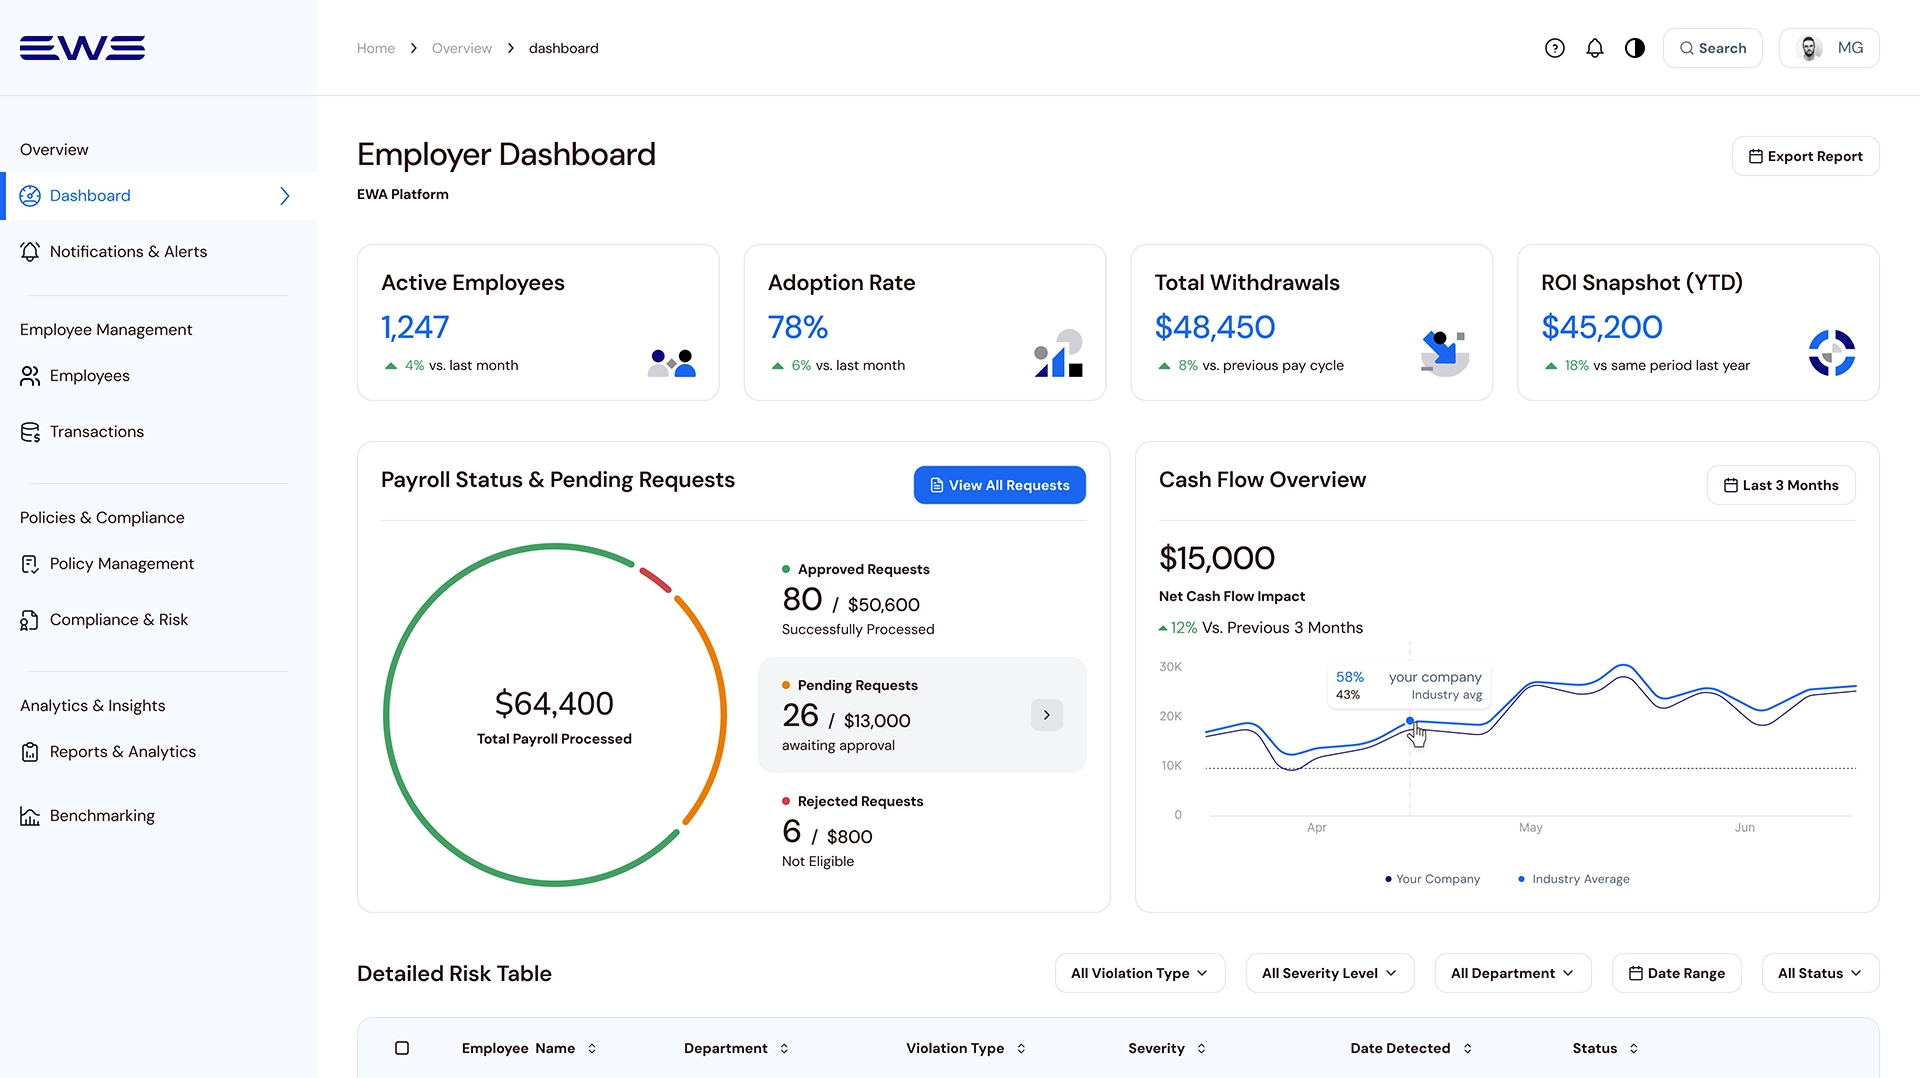
Dashboard Overview
Prioritizing insights for faster decisions.
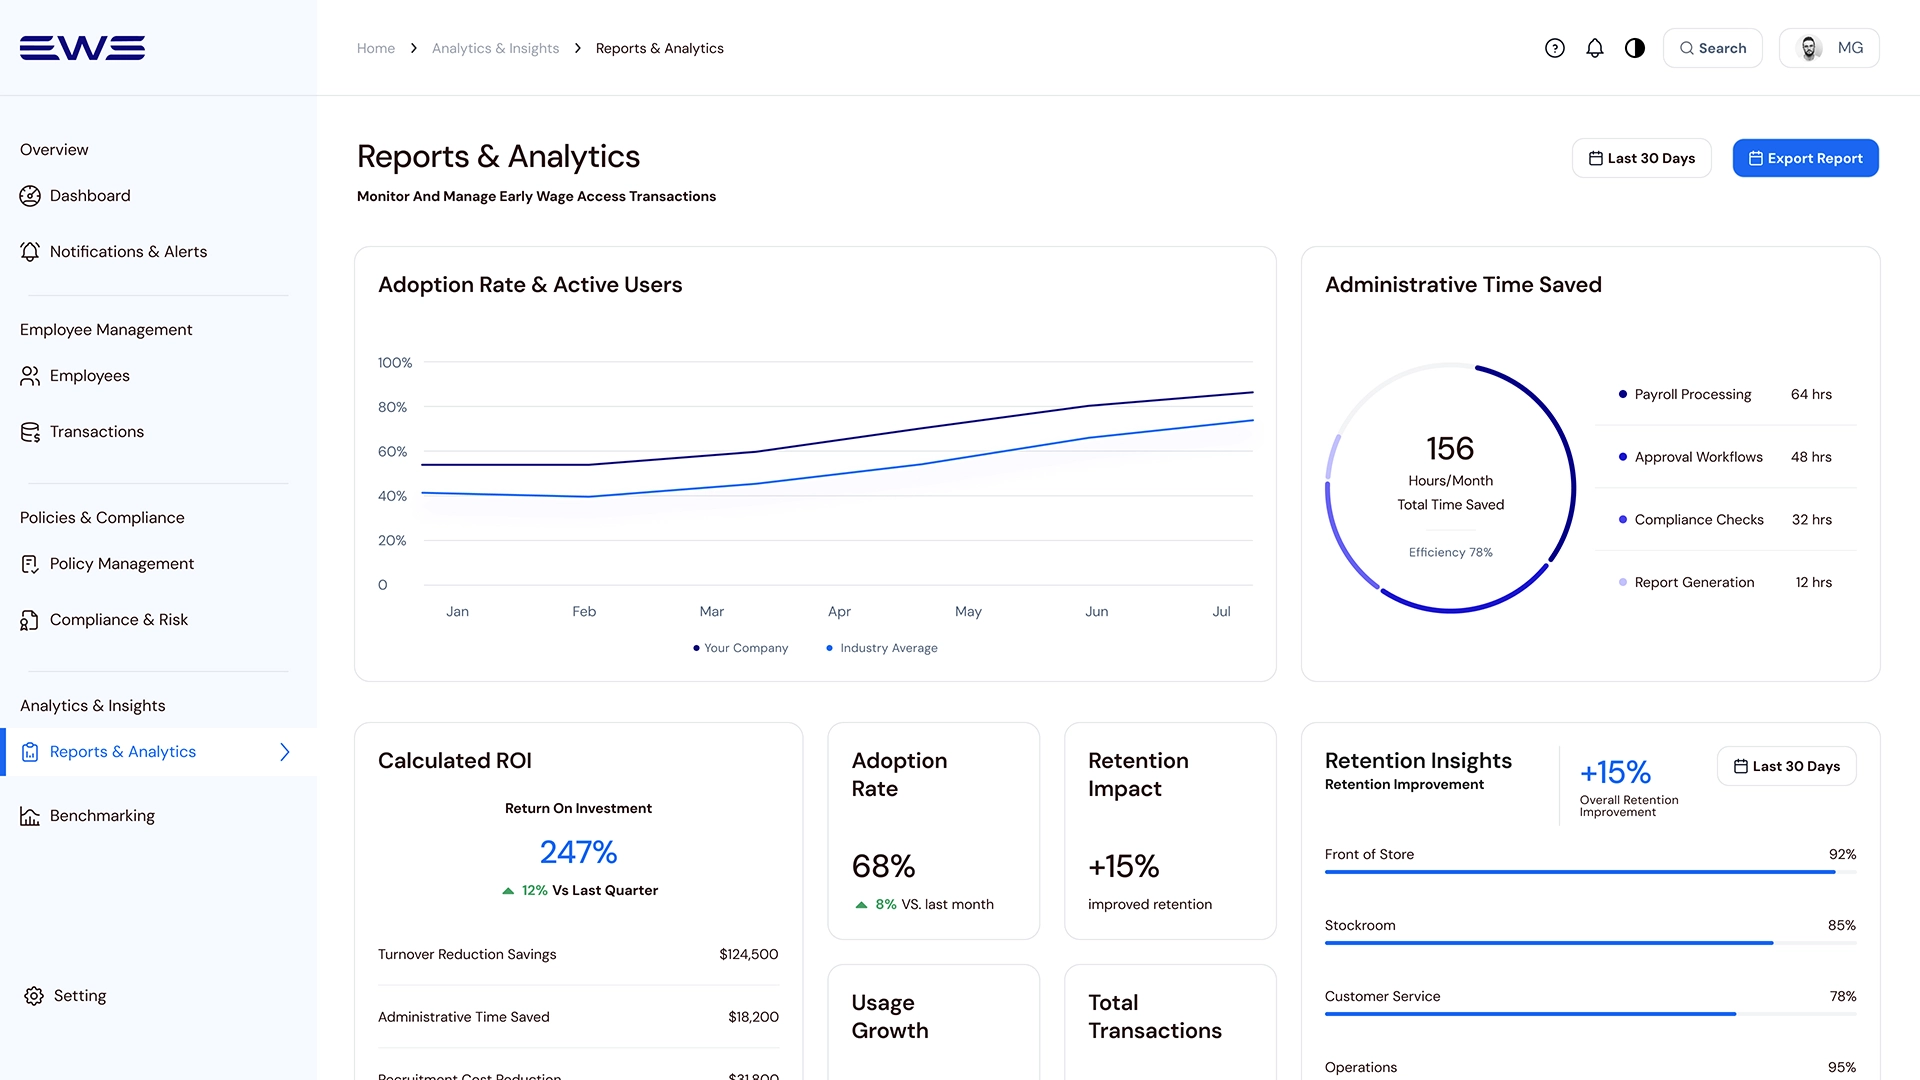
Top KPIs
Quick snapshot of usage, time saved, and retention impact.
Insight Charts
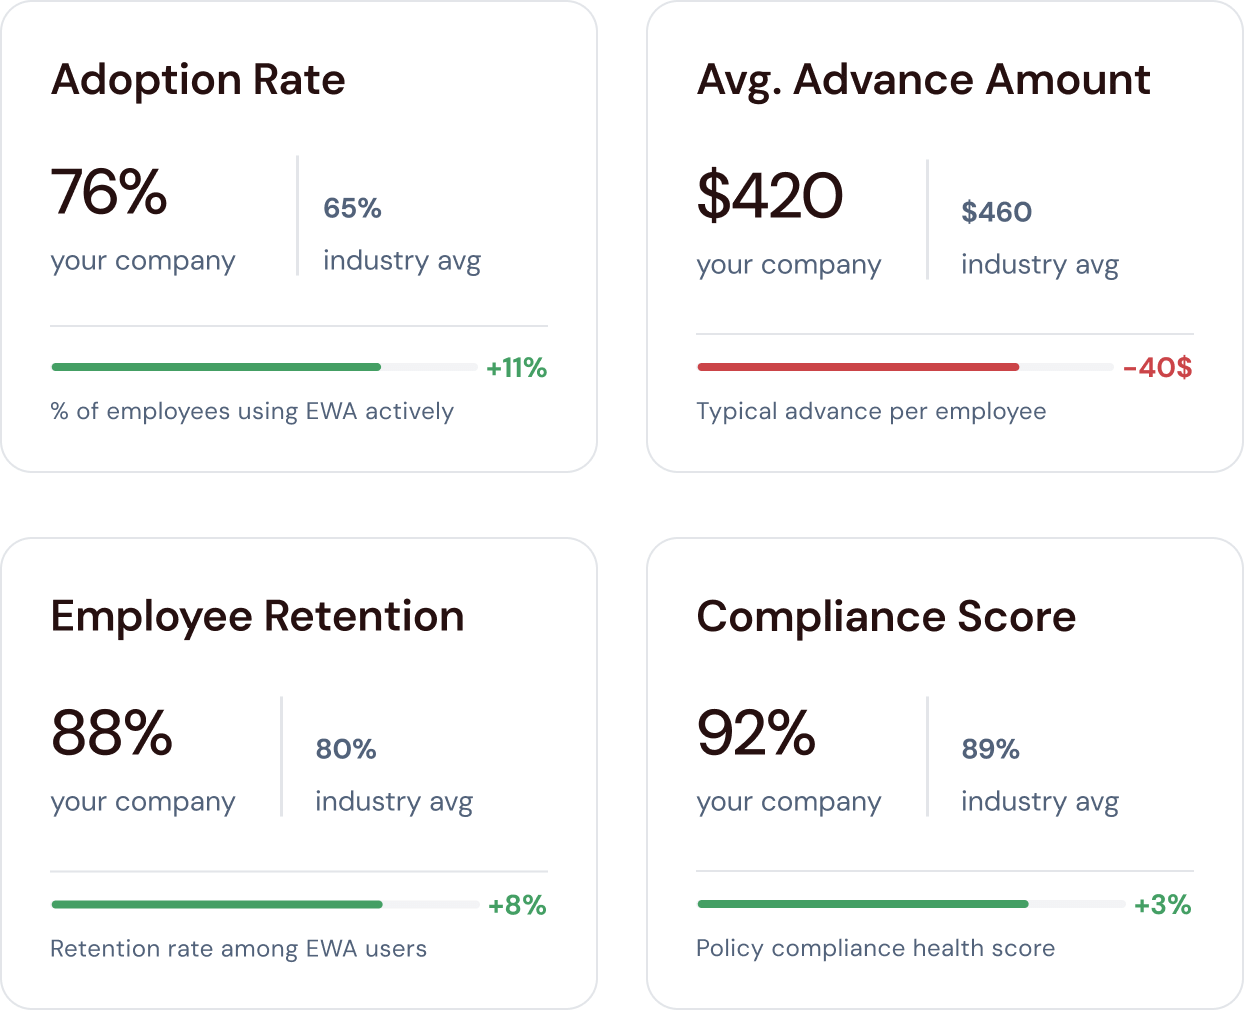
Company adoption and retention vs industry averages.
Pending & Requests
Filterable table for reviewing and acting on requests.
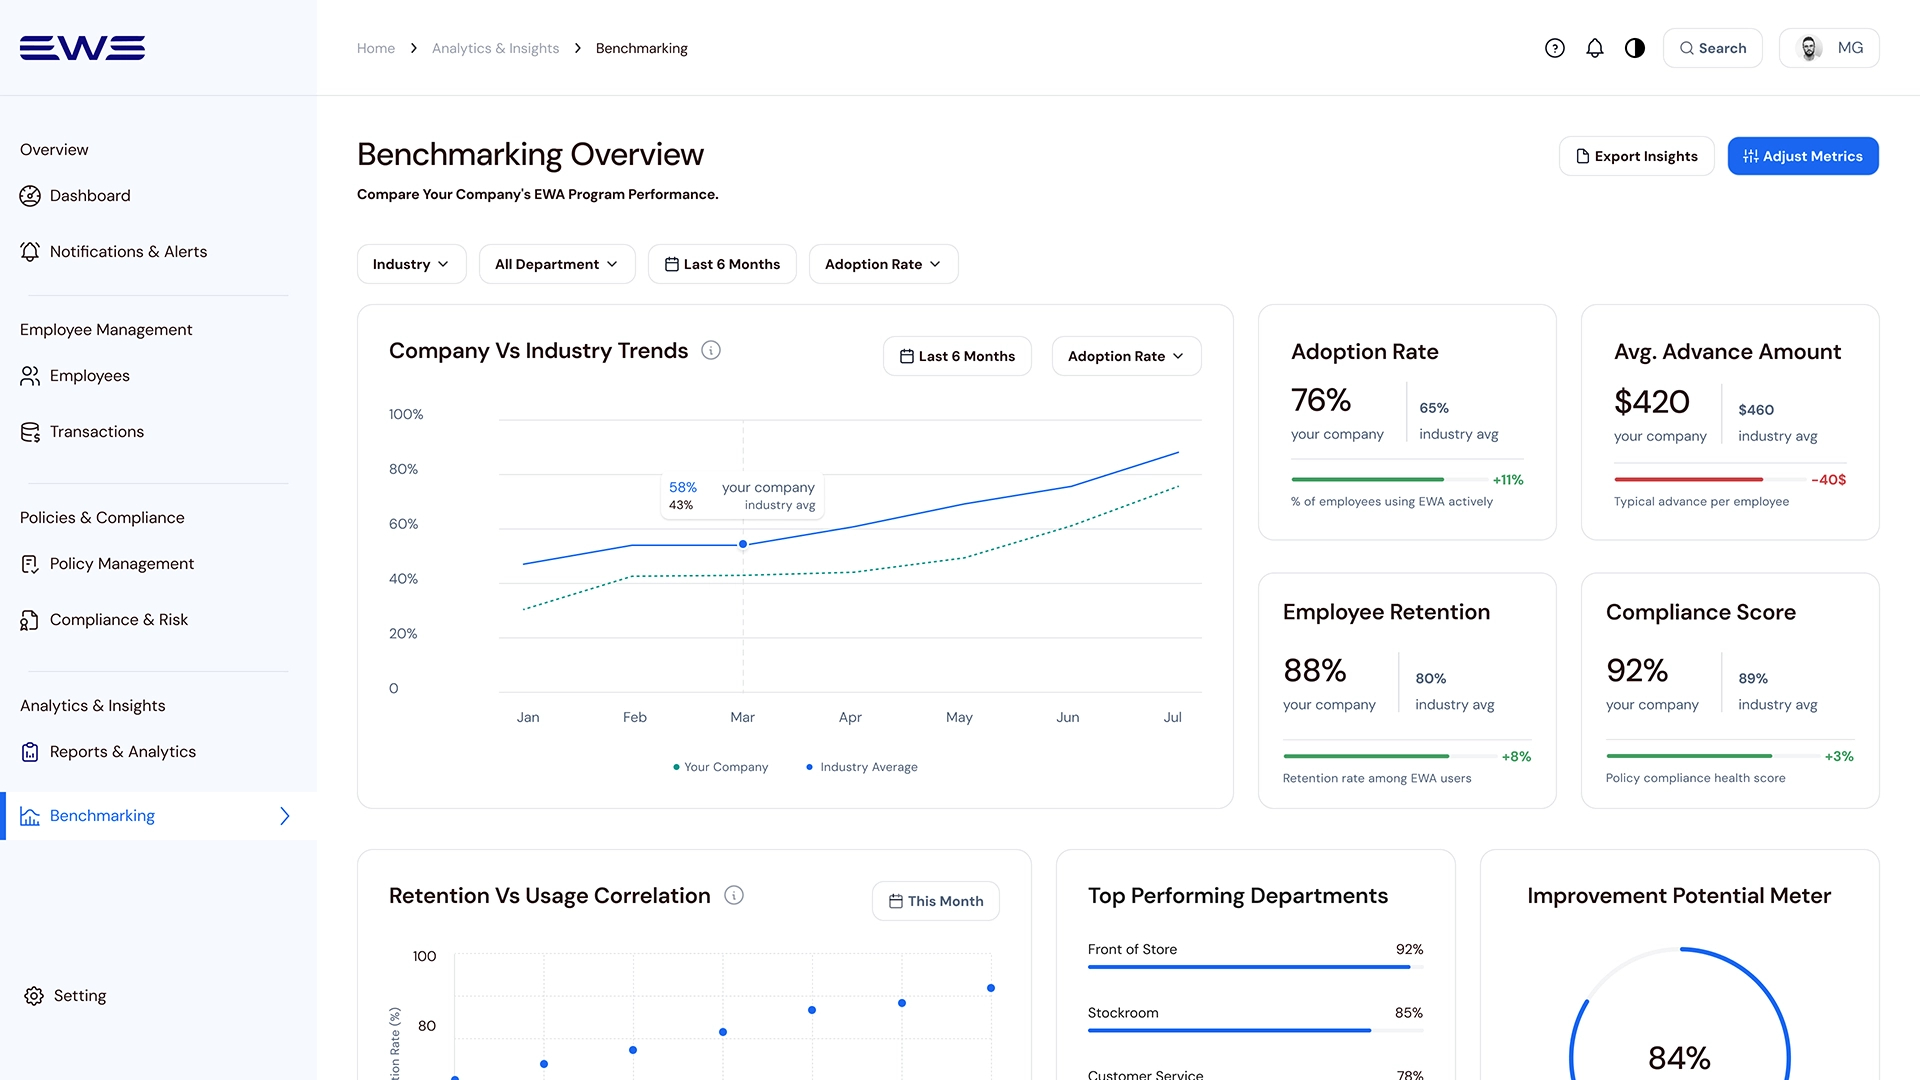
Benchmarking – Validating performance against industry benchmarks
To support strategic validation, this view compares internal EWA performance against industry benchmarks for adoption, retention, and compliance.
Benchmarking validates competitiveness by placing internal performance in market context.
From data overload to decision-ready insights
Reduced managerial decision time and compliance risk through KPI-first design found in prototype testing.
Key improvements:
Insight: Designing for the Next Decision
This project demonstrated that a traditional dashboard becomes a vital organizational control center when designed around decision-making rather than just data entry. By prioritizing decision-ready insights over raw data, managers move from “figuring out what happened” to “deciding what to do next”.
Key Lessons:
Decisions over Features:
Reorganizing the system around decision moments reduced analysis paralysis.
ROI Storytelling:
In B2B SaaS, design must communicate business value - time saved, risk reduced, and retention impact.
Trust and Transparency:
In FinTech, audit trails, risk indicators, and policy clarity are as critical as usability.
Closing Insight: Designing for Decision Visibility
As the Lead Product Designer, I reframed EWA from a payout feature into a strategic management tool, aligning stakeholders around decision visibility, risk awareness, and financial wellness signals. I learned that when financial data is structured around decisions instead of transactions, the product becomes a strategic management tool rather than just a payout feature.
The Next Layer: Predictive Decision Support
Predictive risk signals for early financial-stress patterns
Manager guidance translating signals into actions
Deeper payroll integrations for automated eligibility checks